Enable whole slide tissue analysis for Research and Clinical Applications
High-plex imaging across an entire slide, in a single scan, enables spatial analysis through examining biomarker expression, cell classification, and subcellular localization. Such analysis paves a path for advancing studies in pathology, immuno-oncology, infectious disease, and many more areas of disease. Learn more about the Orion™ Multiplex Imaging Instrument, the critical technology in the Orion platform workflow.
Explore research and clinical applications utilizing the Orion spatial biology platform
 |
Nature Oncogene publication: Neoadjuvant botensilimab plus balstilimab response pattern investigated |
 |
Editorial article: Quantitative microscopy for precision spatial biology: “From samples to knowledge” |
 |
Interview: Bringing spatial biology to the clinic: “A new lens on cancer biology” |
 |
Nature Cancer publication and Harvard Tissue Atlas |
 |
Webinar: Multimodal tissue imaging and machine learning to advance precision medicine |
 |
Webinar: Spatial analysis and high-plex immunofluorescence to study human pancreata in type 1 diabetes |
 |
Webinar: Multiplexed Tissue Imaging using the Orion Platform to Reveal the Spatial Biology of Cancer |
 |
Webinar: Use of open-source software for quantitative analysis of multiplex images |
Rapid tissue analysis for any sample
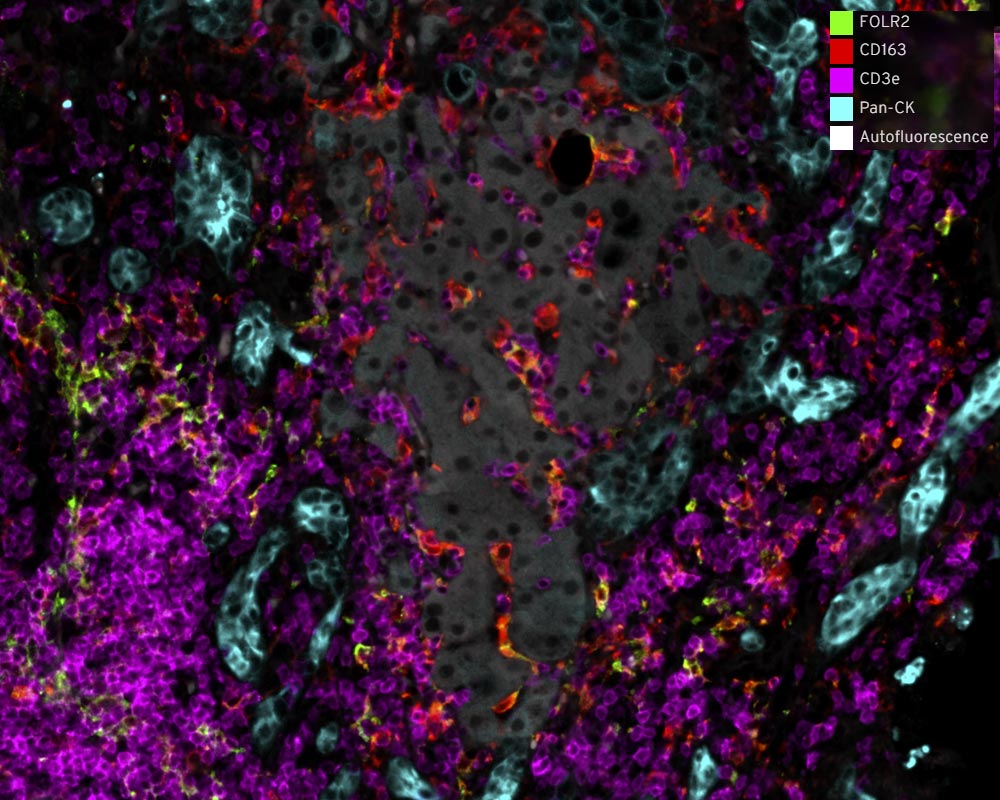
Tongue – Oral Squamous Cell Carcinoma
Whole-slide tissue section of an oral squamous cell carcinoma stained with a 16-plex biomarker panel and imaged with the Orion system in a single staining and imaging process.
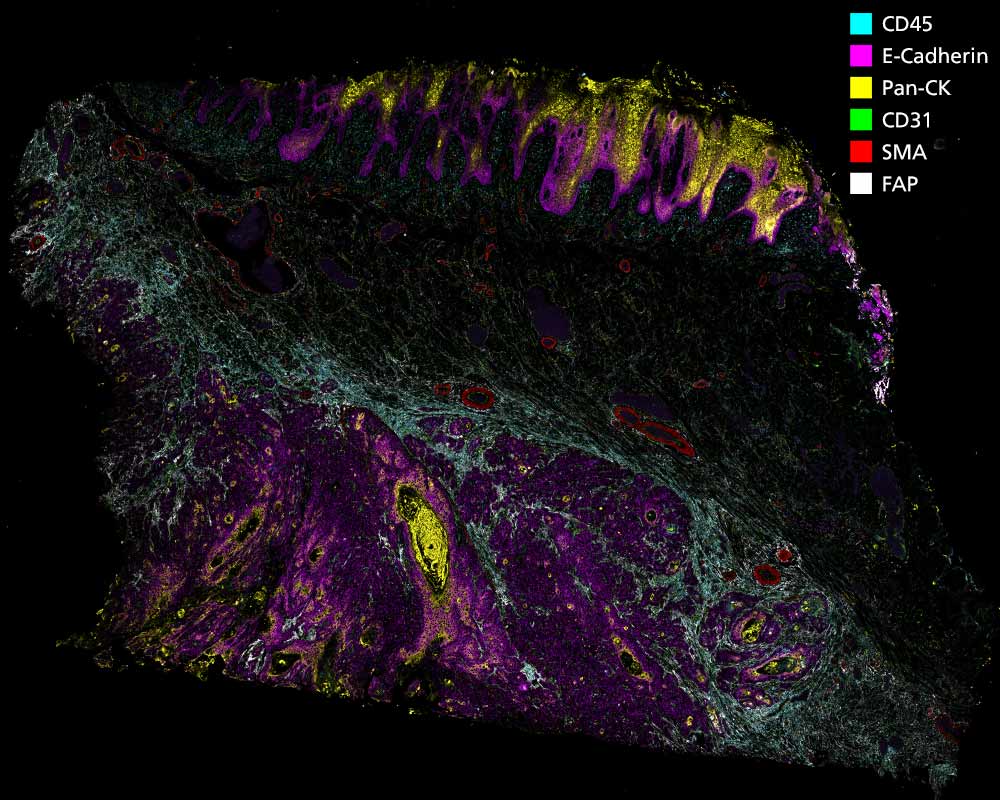
Biomarker panel:
View the full interactive data set ➝
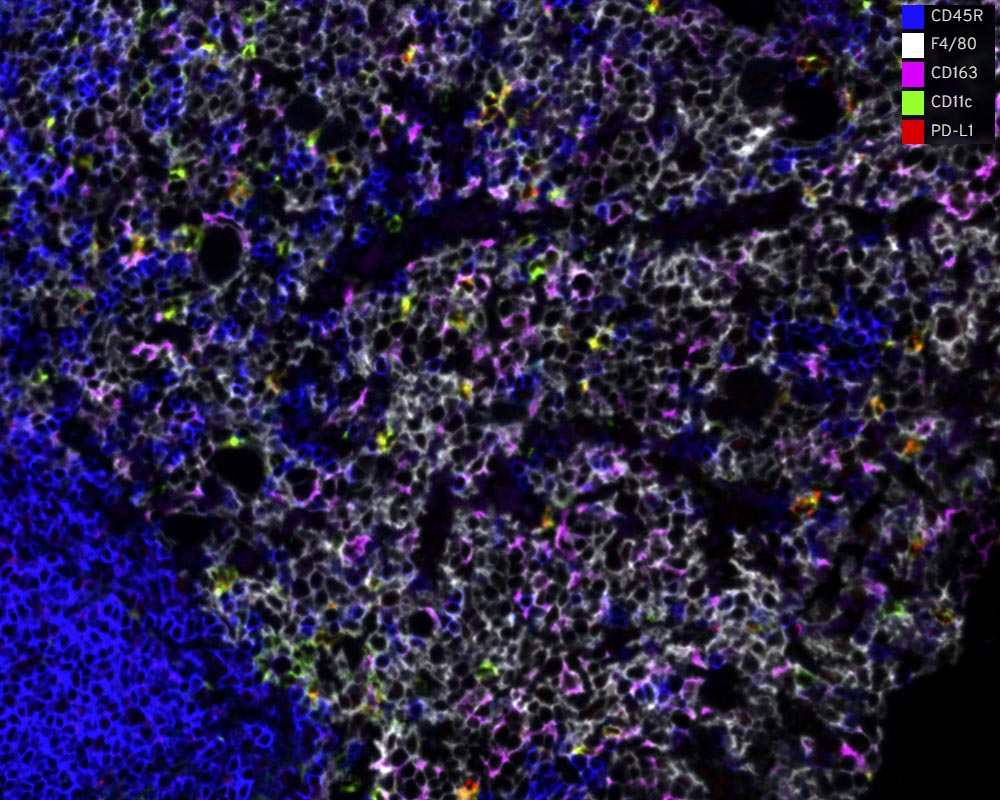
Mouse – Ileum
Whole-slide tissue section of a mouse ileum stained with a 15-plex biomarker panel.
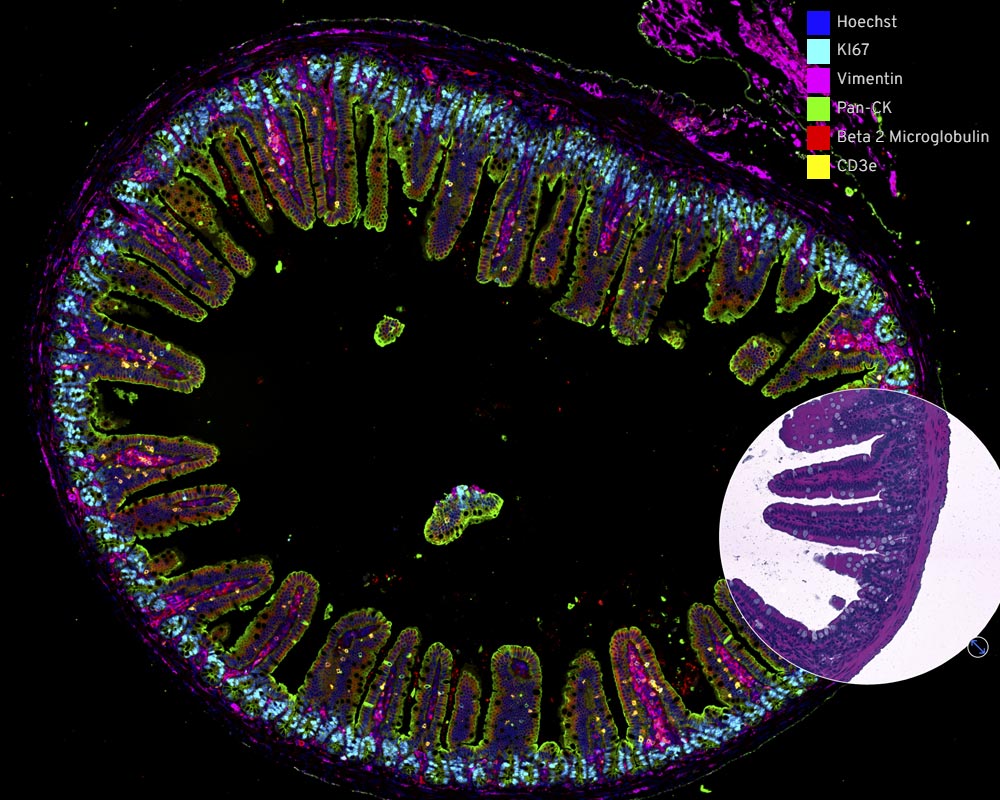
Biomarker panel:
View the full interactive data set ➝
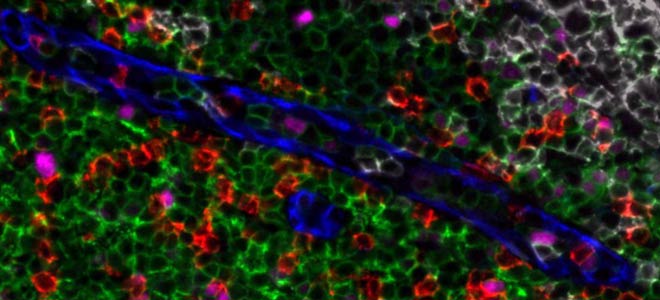
Mouse – Spleen
Whole-slide tissue section of a mouse spleen stained with a 13-plex biomarker panel.
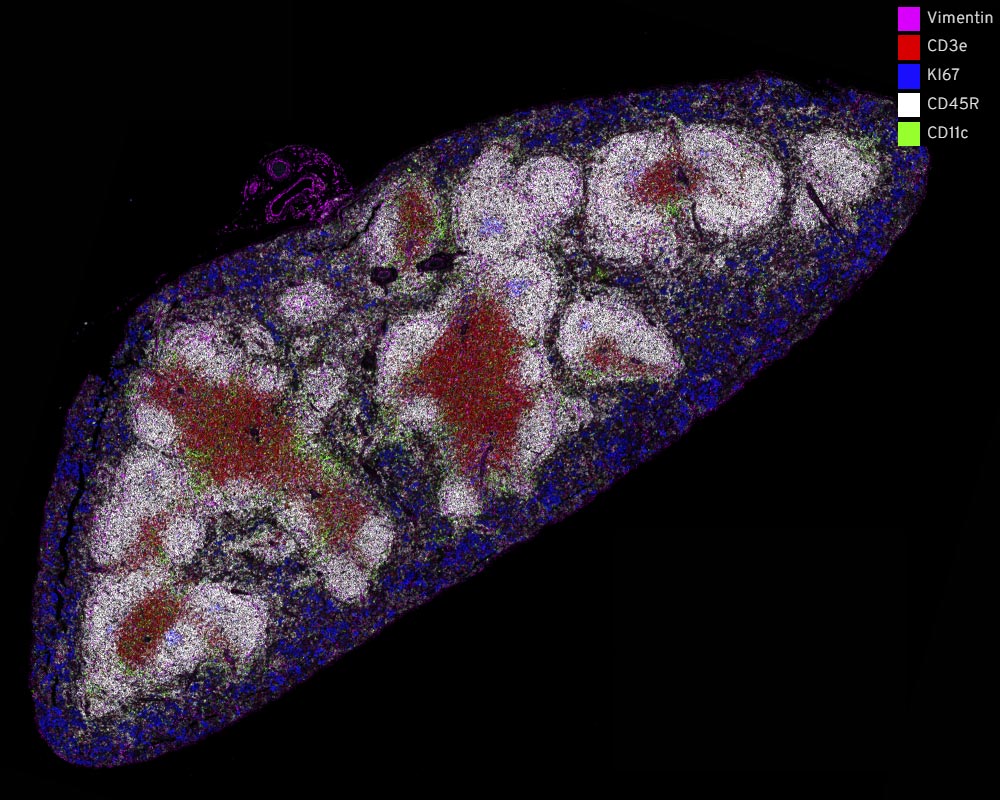
Biomarker panel:
View the full interactive data set ➝
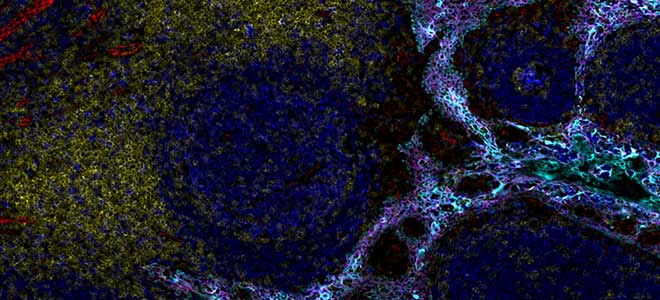
Liver
Whole-slide tissue section of a liver sample stained with a 14-plex biomarker panel.
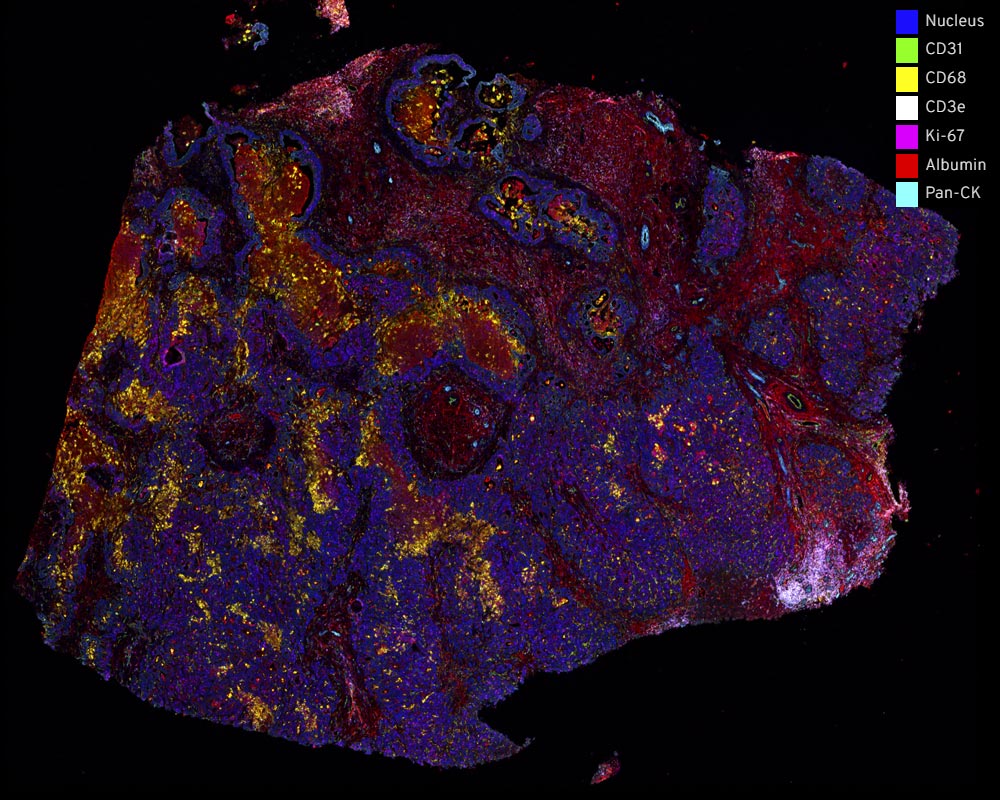
Biomarker panel:
View the full interactive data set ➝
![]()
![]()