RarePlex® CTC Assays: Design and Analytical Validation for Circulating Tumor Cells
Presented by Tad George, Senior Vice President of Biology R&D
Hi, my name is Tad George, Senior Vice President of Biology R&D at RareCyte. This presentation is focused on our RarePlex circulating tumor cell assays. In particular the approach that we take here at RareCyte the CTC assay design and validation.
The design of our CTC assays
Our RarePlex assays for CTC enumeration and biomarker expression analyses are designed for deployment by CROs and for academic centers conducting multi-center trials and therefore assay requirements are set to pharma and CLIA standards with an emphasis on accuracy and precision. RareCyte products are used for all stages of a CTC assay from blood draw to result. Nucleated cells from patient blood samples are processed to slides using our AccuCyte® system stained with our RarePlex staining kits using manual or automated stainers and scanned with our CyteFinder® instruments that include integrated machine learning algorithms that facilitate rapid and concordant results.
Rareplex CTC Assays
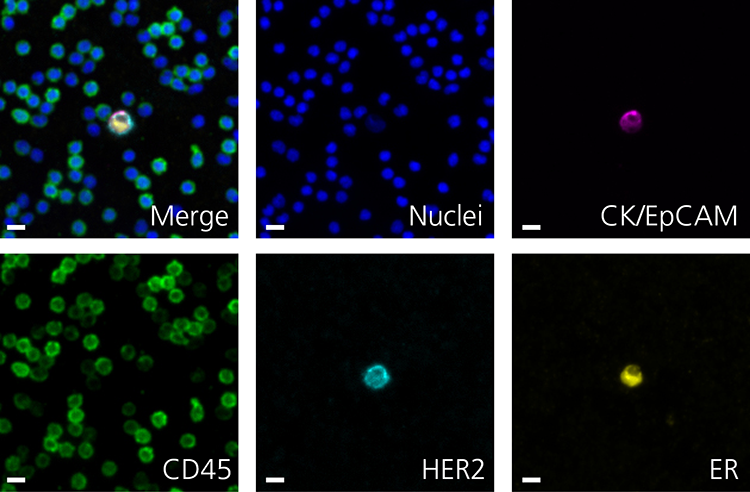
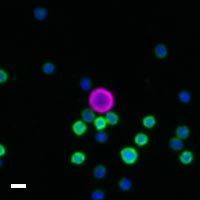
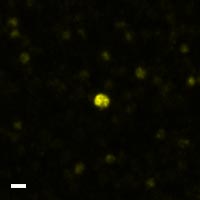
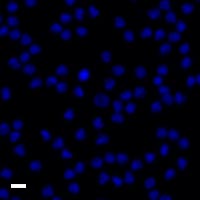
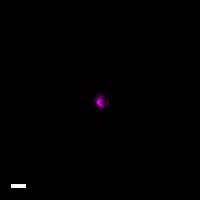
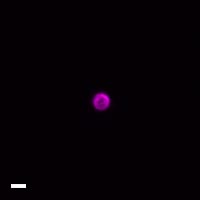
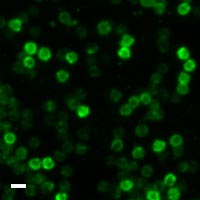
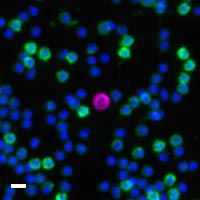
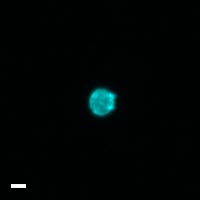
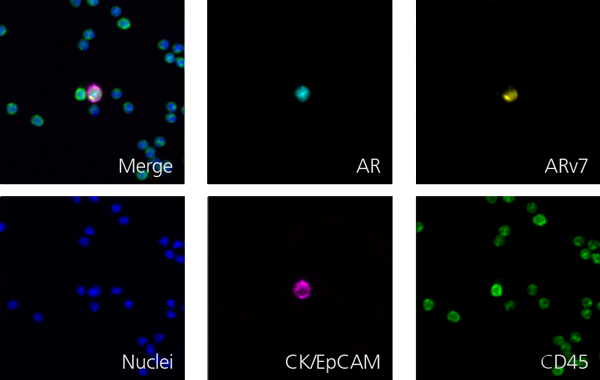
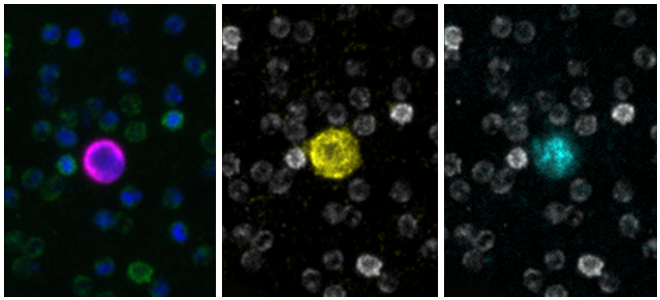
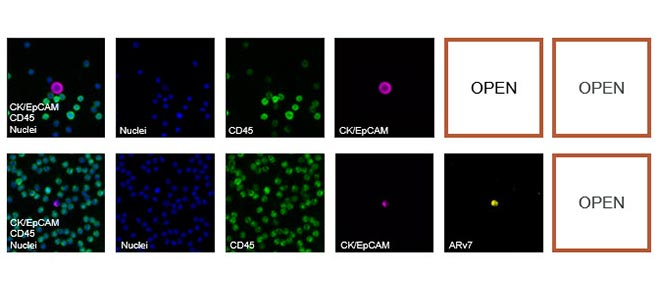
Here are a few examples of clinical CTCs found with our assays showing our standard approach to detection of epithelial CTCs as nucleated events with CK and/or EpCAM expression that also lacks CD45. The middle row shows an ARv7 positive prostate cancer cell revealed with our prostate assay. In the bottom row you can see a HER2/ER+ CTC identified using our breast cancer assay highlighting the biomarker flexibility afforded by the RarePlex assay system.
Rareplex Assay Development Process
Once we have decided to proceed with and assay, our development process is broken into three major phases: design, production transfer, and validation. Design is synonymous with assay optimization. During this phase we establish our surrogate sample controls, screen antibody clones, select the best fixation and engine retrieval conditions and titrate reagents culminating in a locked assay that allows us to define quality control metrics for manufacturing and to set specifications for our subsequent validation. We then transfer the assay and QC procedures to manufacturing who then make the staining kit lot that will be used for the subsequent validation studies.
Validation comprises a regimented set of studies that measure performance of the locked assay with an emphasis on accuracy and precision using a mixture of spike in surrogate samples and clinical samples. In the next few slides, I will show some example data from design and validation phases to give you an idea of the types of studies we perform and the data our system generates.
Design Clone & cell line screen [SYP]
This design phase experiment for our neuroendocrine assays shows data that was used to select the model CTC controls and to select the synaptophysin and antibody clone. Each graph shows synaptophysin in mean fluorescence intensity obtained for a variety of spike in cell lines with different anti-synaptophysin clones. Clone C on the right provide markedly better separation between the canonical pheochromocytoma neuroendocrine cell line PC12 and other cell lines known to be negative for synaptophysin such as HL60. Interestingly, the prostate cancer cell line 22rb1 was found to express high levels of synaptophysin as well. Because we have both a standard neuroendocrine assay as well as a prostate neuroendocrine assay, we selected 22rv1 as our positive cell line control and BT474s as the negative cell line and clone C was chosen for synaptophysin detection.
Design Antibody Titration [SYP]
Once we've optimized fixation and antigen retrieval conditions, we perform the titration to determine the synaptophysin antibody concentration that provides the best signal to background performance.The left plot shows synaptophysin intensity for 22rv1 cells in orange and BT474s cells in black obtained using increasing anti-synaptophysin antibody concentrations in the assay. The plot at right shows the ratio of 22rv1 synaptophysin signal to the background signal for synaptophysin found on surrounding white blood cells at each concentration. We chose the concentration that provides the maximum signal to background - in this case, three micrograms per ml. This experiment highlights how we leverage quantitative per cell mean fluorescence intensity data in our decision-making process as it would be difficult to pinpoint the best concentration by qualitative assessment alone.
Design Representative Images from the Circulating Tumor Cell Assay Test
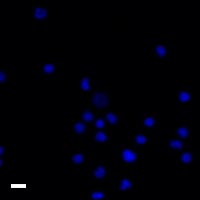
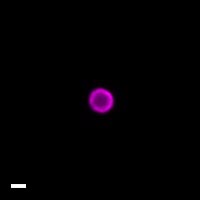
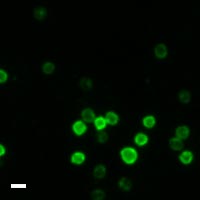
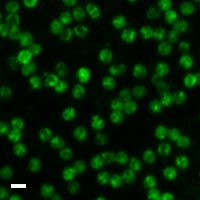
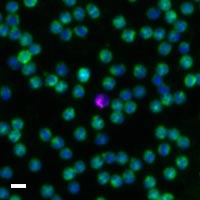
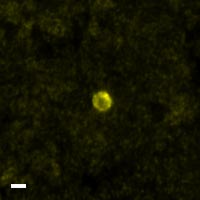
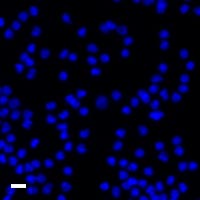
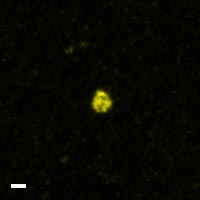
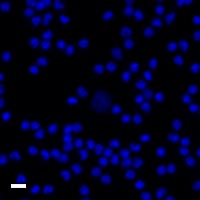
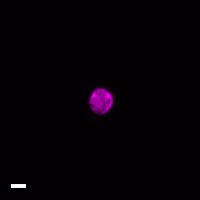
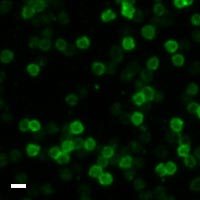
Representative images of 22rv1 and BT474 spike in samples stained with the neuroendocrine assay are shown here. The CTC in the center of each image panel is indicated by the presence of cytokeratin and/or EPCAM staining in green in the absence of CD45 staining. 22rv1 cells exhibit cytoplasmic synaptophysin and staining distribution in contrast to the lack of apparent synaptophysin staining for BT474 cells.
Validation: Enumeration accuracy and recovery for Circulating Tumor Cells Assay
The next few slides shows some of the assay validation studies run after the assay design is locked and using kits produced by manufacturing. Because CTCs are extremely rare often present in single digit numbers in a tube of blood, there's a premium demand on any CTC test to provide a combination of exquisite recovery, sensitivity, and specificity. To quantify enumeration performance, we analyze healthy normal donor blood without spiked in cells which constitute limit of blank or lob samples as well as blood spiked single digit numbers of model CTCs which constitute limited detection or LOD samples. As shown in the table at left, the assay identified 47 of the 49 spiked cells across 9 limit of detection sample replicates for a recovery of 96%. The table at right shows perfect marks for sensitivity, specificity and accuracy using a positive test criteria of more than one CTC per sample. All the LOD were correctly scored positive for CTCs and all the LOB samples were correctly scored as negative for CTCs.
While we are very proud of our enumeration performance as measured with spike in surrogate samples, we recognize it is most important to accurately detect clinical CTCs in a study shown here performed by one of our customer labs as part of their CLIA certification study using our enumeration assay, CTCs from approximately 50 paired draws from prostate and breast cancer patients were enumerated in a blinded fashion using the RareCyte assay on the y-axis and the FDA-cleared cell search test on the x-axis. The comparison showed a high degree of correlation between the assays demonstrating the rare site assay performs as expected for indications for which the gold standard is cleared.
CTC Validation: Establishing the biomarker MFI threshold [ARv7]
The next few slides cover validation studies for biomarkers that leverage the use of MFI thresholds. For novel assays we utilize biomarker positive and biomarker negative cell lines to set an MFI threshold that is subsequently used to determine biomarker accuracy and precision. Here we show the data used for setting the ARv7 threshold for our prostate assay. Accuracy shown with the gray line and specificity indicated by the orange bars, are plotted at different ARV7 MFI threshold values. Specificity is the fraction of biomarker negative cells identified as ARV7 negative while accuracy is the fraction of correctly classified ARv7- and ARv7+ cells using a given threshold. For this assay, an MFI threshold of 100 provided maximum accuracy with a specificity well over 90%.
CTC Validation Biomarker accuracy [PD-L1]
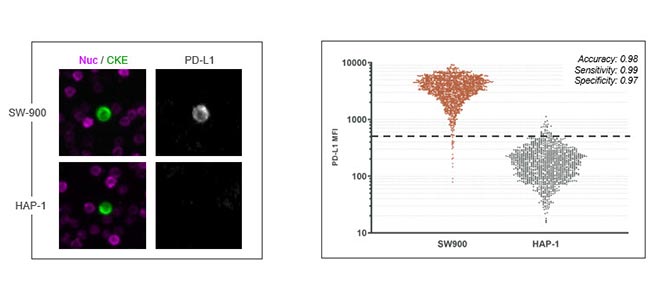
Here we show measurement of biomarker accuracy for our PDL1 assay. The plot at right shows PDL1 MFI values obtained with the assay for sw900 and app1 cells and a dotted line to indicate the threshold sensitivity of 0.99, a specificity of 0.97 for an overall accuracy of 98 percent indicating a highly reliable assay for PDL1 detection.
Validation Biomarker expression on clinical CTC [HER2/ER]
Here we show precision measurements for ARV7 prostate assay. In this study, seven replicate 22rv1 samples were stained with a prostate assay on each of three stainer runs. Each box and whisker column represents the ARv7 MFI distribution for a single sample. The percentage of ARv7 positive cells is determined for each replicate with a threshold indicated by the dotted line. Using this approach, the repeatability coefficient of variation values ranged from 4.7 to 10.9 percent for the replicates within a run, while the inter-run intermediate precision across the three runs was 3 percent, demonstrating highly consistent detection of ARV7 expression by CTCs with the prostate assay.
Here we show detection of HER2 and ER on CTCs from breast cancer patient samples using our breast CTC assay. The plot shows HER2 versus ER MFI for individual clinical CTCs with representative images shown at right for color-coded points on the graph. From top to bottom, a double positive cell corresponding to the orange dot in the upper right quadrant A HER2- but ER+ cell corresponding to the gray dot in the upper left quadrant and a double negative cell corresponding to the dark dot in the lower left quadrant of the plot. The overall distribution reveals the heterogeneity and expression of these biomarkers across multiple CTCs in the clinical setting.
Rareplex CTC Staining Kits
Here is a list of the staining kits available now are coming soon from RareCyte. In this brief presentation, I've shared some data from all of these assays and want to point out the detailed assay validation reports are available from RareCyte upon request. In addition to the indication specific assays, we also provide developer kits that allow you to add up to two additional biomarkers to a RarePlex CTC assay. Note, these kits use the same developer technology deployed by our scientists to develop our biomarker assays. RareCyte also offers assay services for the development of custom assays.
Rareplex RUO Assays
In summary, our RarePlex assay development process really incorporates a few key cornerstones. First of all, assay requirements are set to pharma and clinical standards with guidance from client industry experts. There's an emphasis on accuracy, precision, reproducibility and clinical data during our validation. We leverage proprietary developer technology for sensitive biomarker detection on CTCs and we also use quantitative imaging-based decision making during our assay design. This is all wrapped into an end-to-end CTC platform to meet your testing and research needs. Thank you very much for your time and feel free to reach out to us if you're interested to learn more about our RarePlex assay process, deployment of CTC assays in your lab, or for information on our custom assay services.
For more information, please contact us at info@rarecyte.com.
