Advanced Spatial Analysis: Applying Cellular Phenotyping in Health and Disease
Hello everyone, welcome, Just a couple logistics before we get started with our presentation. There is a chat box which you can either submit questions there or there is the question-and-answer box or pop-up. If you do have questions, please submit your questions there and we will take those at the end. In case we do not get to all the questions, we will be following up via email so do expect that in case we do not get to your question and at this time, I’d love to present our speaker, Mickael, the floor is yours.
Rarecyte: Precision Biology for Life Sciences
Thanks for joining us. So very briefly a few words about RareCyte. RareCyte is an American company founded in 2009 and based in Seattle and we are a Precision biology company developing high performance microscopes dedicated to pathology type samples, all type of biopsies including liquid and tissue biopsy. At RareCyte, we focus on two main areas. First the RareCyte analysis and retrieval of the cell. It’s mainly used for the circulating tumor cells the CTC and second the fast-growing field of spatial biology and its highly multiplex tissue analysis.
Unlocking Spatial Biology with Orion™
Today, I will talk about the Orion which is a really high speed, highly multiplexed, spatial analysis matching platform and if some of you are interested, contact us after the webinar and we, I will send you a few words about, the CyteFinder II instruments here on the left which includes beside the imaging parts and onboard device for the microregion retrieval to collect the cells of interest for downstream genomic analysis.
So, why did we develop the Orion system? As you know, tissue consists of heterogeneous cells type, each with diverse function and functional states, arranged spatially in a way that it impacts the patient health status and our main goal in spatial biology is to understand which cell types are present, where they are exactly localized in the tissue but also determine the pattern of biomarker expression easily at the cellular level. The goal is also to understand how the cells organize and how they interact to influence the tissue microenvironment. So, resolving this complexity is challenged by several things, it’s challenged by the autofluorescence of the cells and it’s mainly challenged by the overlaps of the different fluorescent signals which limit the number of targets that can be simultaneously evaluated. It’s also challenged by the very low throughput, usually due to a very long, multi-cycle staining procedure and, also by a very slow acquisition time. Last thing, it could also be challenging to determine where our localized good regions of interest across the whole tissue section.
Orion: Spatial Biology Realized
So, the Orion technology breaks these barriers, providing rapid, straightforward, highly multiplex whole slide tissue analysis. We have developed the Orion to bring together the most desirable features of an optimal tissue imaging platform compatible with pathology workflow. So, Orion enables whole slide imaging of FFPE and frozen tissue sections on the slides. It enables rapid, single round staining and imaging, simultaneous investigation of 15 markers or more. The imaging with subcellular resolution, Orion has an autofluorescence reduction to assist detection of flow expression proteins. It also has wide field imaging capability, enabling some same section H&E staining. We offer flexible panel design with commercially available antibodies and labeling kits and Orion has compatibility with established image formats for the data and metadata.
This slide shows the requirement for spatial biology that we just reviewed in the previous slide and the key components of the Orion platform that work together to meet those requirements. While the instrument is important in all areas, we have also put significant effort into the fluors used for staining and the extraction process and I will touch on all of these items during this presentation.
So from a high level, Orion has a very straightforward workflow. Essentially, you prepare your slides on traditional microscope slides so normal tissue sections and we are working mostly with FFPE preparation. The staining is actually a single step staining process. There are no iterative cycles here. It’s done with ready standard autofluorescence protocol with all the different biomarkers addressed at the same time, so the staining doesn’t take very long to be done with our procedure. Then it takes only one scan for all the fluorescent channels. It takes about 75 minutes per square centimeter to perform the full scan of all the channels in only one single pass. So, only few hours to image the whole tissue, the whole tissue section on the slide. And then the data can be analyzed downstream, either onboard, qualitative software named Artemis, or on the third party software.
Orion Benchtop Instrument for Spatial Analysis
Here are the main specifications of the instrument. With this small footprint, it can be installed on a standard bench. You have the dimension here, it’s about a cube of 55 centimeters. Channels are narrow and high in number but typically we do 10 to 20 for best quantitative reproducibility. The scan is very fast, it’s about 75 minutes per square centimeter. It scans the whole slide and the system can hold two slides at the time. The system employs autofocus. It comes with four objectives that are listed here, 4X,10X, 20X and 40X and we usually use the 20X. It has seven lasers from 405 to 730 nanometers and a scientific CMOS camera.
ArgoFluor™ dyes and narrow emission bands
The seven illumination lasers allow us to collect data across a broad wavelength range. These curves represent spectral scans of about 50 Arguofluors to date. You can note the overlap and while we could image all of these probes simultaneously, the amount of crosstalk would compromise data quality, so we choose a set of dyes that are spectrally spaced, and we tune the emission filters to capture the different peaks. The very narrow bandwidth of the emission filters limit the crosstalk and therefore, we are able to accurately measure and control the overlaps between the different fluorescent channels that we use here. Typically we use 10 to 20 channels simultaneously for obtaining the best result.
Spectral Matrix
The overlap is measured to generate the spectral matrix which is used by the extraction process to isolate individual target images, to separate channels in the output data, and keep in mind that this type of extraction is fully automated so the user doesn’t have to do anything at this step.
Spectral Resolution of overlapping signals
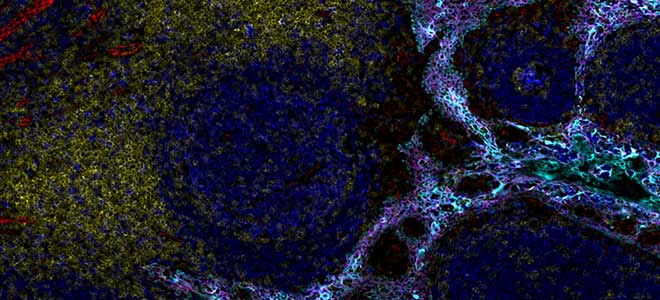
To illustrate this, we can see here this section of lung stain with five key biomarkers, cytokeratin CD68 and 3 T cell markers. The five antibodies used here are directly conjugated to five dyes which are all from the same region of the spectrum, the orange region, so around 600 nanometer, and the Orion is able to resolve all these signals so each individual biomarker can be visualized independent and then the software will create for you a pseudo color composite with the signal spectrally and spatially resolved. This process is automatically performed. There is no intervention needed from the user here. Keep in mind that here, for this example, we have done this for a single spectral region but now with Orion and using its seven lasers, you multiply this across the entire spectrum and so you increase a lot of possibilities for multiplexing.
Customizable Orion Panels
We have also optimized some panels. For example, our immuno-oncology 12 plex panel contains the typical immune response marker and also some specific checkpoint marker. And our immune-response 9 plex panel which is here above is giving a more general immune response. Those two core panels offer some flexibility in order to include custom biomarkers of your choice such as architectural markers, cancer-specific biomarkers, but it could be also markers of the cellular cycle or specific of a disease for instance.
Whole Slide High-PLex Imaging with Any Sample
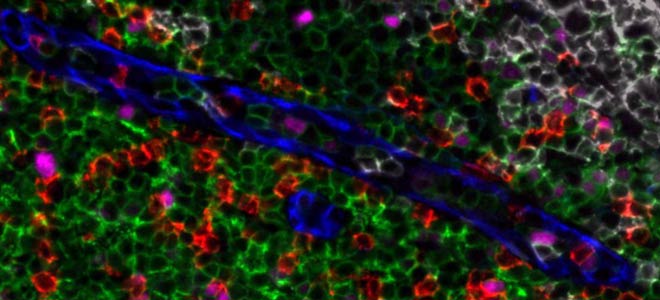
Thanks to the possibility to customize its own biomarker panel with Orion, we can assess any kind of sample, lung, melanoma, tonsil, thymus, pretty much any kind of tissue that we can put on the slide will work with the Orion system including tumor microarrays, the classic TMAs as you can see here in the back of the of the image. And we can do that because Orion has the ability to scan the whole slide and so it makes this feasible.
Whole Slide High-plex + H&E Imaging
It’s actually quite common to perform a serial section for Hamp;E staining. The hematoxylin and eosin staining to look first for specific areas of concern and then look deeper with the immunofluorescent staining. With the Orion workflow it’s actually feasible to get the Hamp;E imaging of the same section, so the same exact slide. What we do is we first stain the sample for the multiplex fluorescence, do that imaging using the Orion system, remove the cover slip of the slide and then we stain it with Hamp;E and image it again using the widefield mode of the Orion system. So we can see for the same section the Hamp;E is staining as well as the high plex fluorescent imaging.
Biomarker panel used in this study
At this stage, I would like to show you some real data obtained from a colorectal carcinoma sample and this is the biomarker panel used in the study to generate the image that we are going to review together today. It corresponds to our 12-plex immunology core panel plus five extra markers plus the nucleur dye and the autofluorescence channel. So I’m going now to open the Orion software named Artemis and we will have a look at a full scan of a colorectal carcinoma sample.
Orion Software
Okay so first of all when you open the image in Artemis you have the global view of the tissue so it’s fully un-zoomed just to give you the orientation of this image on the far right it’s the bowel lumen, in the center we will find the tumor, and on the left side here it’s the smooth muscle. On the far left, right here it’s some adipose tissue. Using the wheel of the mouse you can easily zoom in and zoom out. And thanks to the pyramid tif format of the image zooming in and zooming out is smooth as you can already notice the good resolution here allows us to really have a look at the phenotype at the single cell level.
This image has been acquired with the 20X which gives a resolution about 0.5 micron and there is also a 40X objective on the Orion instrument. To help with the visualization and the understanding of these 17 biomarkers staining, it’s easier to look at combinations of given biomarkers and for that we have already grouped some channels and we created seven visualization groups. We can see them here on the left. In each group, you can decide to make visible or not each of the markers by just clicking on the marker here.
On this general view at the far right of the image, we have the mucosal surface of the tumor. The tumor cells are labeled with two markers the cytokeratin in blue and the E-cadherin in light blue. In the center of the image we see that the tumor cells invade beneath the mucosa into the smooth muscle which is labeled in pink using the marker SMA, SMA stands for smooth muscle actin. And thanks to the marker CD45 in yellow, we observe also a dense collection of immune cells at the base of the mucosa on the right and also have the invasive margin of the tumor in the muscle wall here.
If we Zoom now on this area of the section at the top where the tumor has not developed, we observe a normal colonic epithelium. Let’s switch off panel here and let’s do.
We can see here in blue a lot of typical and uniform colonic glandular structures they are called crypts and they are labeled in blue with cytokeratin and E-cadherin. These crypts are encircled by myofibroblasts in the lamina propria between the crypts, we see these myofibroblasts thanks to the marker SMA here in pink around the crypts. SMA also marks the boundary of the mucosa as we see here around the tissue. The lamina propria also contains capillaries and small lymphatic vessels which are CD31 positive so they appear here in green. Finally, there are also some scattered Ki67+ proliferating cells present inside the crypts. Ki67 is displayed here in red and it’s a nuclear marker and this is part of the normal regenerative process of the mucosa. We can see some qualified T cells here, here, here also.
If we navigate now to the center of our tissue section in the tumor area and if we use another channel group, I’m going to switch from this one to this one. We are going to zoom in this area here. We can see here in this area that the adenocarcinoma cells express uniformly E-cadherin which is the membrane cell to cell adhesion glycoprotein and its display in light blue. The cytoplasmic cytokeratins in dark blue are prominent in the groups of cells that appear larger and have less uniform shape within the malignant glands like we can see here, also here. In contrast to the normal crypt cells that we were looking just before, here in the tumor area there is a large fraction of the tumor of cells that are Ki67+ in red meaning that the cells are in a proliferative phase. Finally there is a dense collection of activated immune cells CD45RO+ here in green and it’s prominent between the cancerous glands. A few of these cells are B cells as they are CD20+ and they are clear in pink. We stay in this area but let’s look at the different biomarker group to focus more on the T cell markers of the panel. So now CD8 is in red, CD4 in green, the nuclear marker FOXP3 in pink and PanCK stays in dark blue. Let’s zoom a little bit more. As you can see most of the cell, most of the cells in this dense collection are CD4+ T helper cells which can also be seen between the tumor cells. We can notice within the CD4 population some regulatory T cells as they are the marker FOXP3 here in pink. Finally, there are also some CD8+ cytotoxic T cells present here in red but there are much fewer in number than the CD4+ cells.
Let’s move now on the left part of this tissue section as I would like to show you the invasive border of the tumor. So I have selected a group of markers to see at the same time the smooth muscle in pink, the T cells in green and the tumor cells in blue. We see here very clearly the invasive border of the tumor on the left part and if we zoom for, for instance we are going to zoom in right here, they have some clusters of malignant bedding cells in blue that are broken off from the granular structures and they have infiltrated further into the smooth muscle. These infiltrative cells are actually surrounded by the green T cells as part of the host response to these invasive cells. In contrast with the other tumor regions in the infiltrative border we see that first the fraction of the proliferative cells is much lower. We count less Ki67+ cells that are in red and second, the level of staining of E-cadherin in light blue here is reduced and in parallel the presence of the cytokeratins in dark blue is not pronounced. This last observation is consistent with a down regulation of the E-cadherin in the invasive cells that is part of the epithelial mesenchymal transition leading to a more aggressive tumor behavior. In the 17 marker panel used in this study, we also add markers of the image checkpoint so let’s switch a group of markers to focus more on PD-L1, PD-1 and the macrophages marker.
So I have un-zoom a little bit and at the bottom of the tissue I can see that this region seems to be rich in pink color here which correspond to the PD-L1marker. Let’s zoom into it. The T cell macrophages surrounding the tumor cells in this region can be identified by two marker, CD68 in green and CD163 in red. The macrophages are an important source of the checkpoint PD-L1 in tumors. PD-L1 binds to PD-1 at the surface of the T cells to suppress the anti-tumor immune response. The marker PD-1 is here in light blue and PD-L1in pink and the colocalization of PD-L1 on macrophages expressing both the marker CD68 and CD163 can be seen prominently here on the on the left of the image. And on the right in this area it seems that the CD68+ macrophages in green are more prominent than the CD163 in red, and the number of PD-L1+ is also lower. Here we can really observe a different neighborhood of expression in contrast the PD1 positive cells which are in light blue are present in both area in left and right. We can see better if I just let PD-1 here. I have one more PD-L1 in pink and so you can see the PD-1+ cells in lightly.
Last thing that I would like to show you on that tissue for today, it’s the benefit of using a channel dedicated to the autofluorescence. So one more time I’m going to switch off channel group. I’m going to un-zoom so we can see the full tissue section. Let’s move for example here in this area at the center of the tissue section.
The column contains nerves that control the peristaltic contraction of the bowel. The extracellular matrix within the nerve fibers can be simply visualized and identified by using the auto fluorescence channel of the Orion. So the autofluorescence becomes here an additional marker as you can see the blood vessels that supply the nerve are here identified by the endothelial marker CD31 and it’s displayed in red.
Okay one last time let’s zoom out to see the full tissue section. One last time I can switch off the visualization group from the autofluorescence to this first group. Sso we can see the same image done at the beginning as I mentioned earlier. It is possible to switch off and switch on the different channels as you wish so I can show you that. I can switch this one and this one and this one for instance to keep only the nuclei and the CD45 for instance I hope you have appreciated this little guided tour of this image of a colorectal adenocarcinoma slide stained with 17 biomarker panel and we can now move back to the PowerPoint.
Orion Data
If you’re interested to look at more images acquired with Orion, I would like to invite you to visit our website so to explore the data. It’s easy just go to RareCyte.com/interactive and click on the data set you wish to explore.
The first data set is the is this 17-plex Imaging of the colorectal adenocarcinoma that we have just reviewed today during this presentation and the second is a 16-plex imaging of oral squamous cell carcinoma the third one is a 17-plex imaging of a lung sample and we have another one coming very soon on tonsil.
Once you have selected one of the data sets you will then be able to look at the whole slide scan and to zoom into it as you wish and display the different colors corresponding to the 16 or 17 biomarkers, so all images are already annotated to help you to navigate into the whole tissue and identify some specific regions of interest.
Orion Data Analysis
Before concluding, a few words regarding the analysis of the files obtained with Orion. So we are providing the Artemis software to visualize the images acquired and from Artemis we can export pyramidal open source format files and the analysis can be done on many software solutions already existing such as a Qpath, Halo, Visiopharm, but also some open source and free analysis solutions that have been developed by different research group. Orion can be easily integrated into an existing quantitative analysis pipeline without the need to modify the exported files. To finish just to let you know in parallel we are currently working at RareCyte to develop our own file for the quantitative analysis of the data generated with Orion and this will likely be presented in a future webinar.
This is the end of the presentation, thank you all for your attention and I hope you are now enthusiastic to join the world of spatial biology using our Orion technology and we can move now to the Q&A session.
Q&A about Spatial Biology with Orion
Thank you, Mickael, this does conclude the presentation. We will take questions and a reminder you can submit questions and the question-and-answer box you might find on the bottom of your screen or there’s three little dots with the word more, it might be underneath there.
Can we take snapshots of the image from Artemis?
Mickael, first question that we do have so in regards to Artemis the Orion software, can we take snapshots of the image from Artemis.
From Artemis we can take a snapshot we can export part of the of the file if the people wants to person wants to zoom into a specific area and only export that using the channels of their choice using the zoom of their choice. Yes is the visualization tools but you can export in a key format whatever you want.
Perfect, and can you explain just a little bit more how to export.
How is the export? The type of file that you export is a tif format that can be open in many typical software for image. Could build open Fiji ImageJ but also some more complex solution to our to the quantity quantitative analysis again after minutes at this stage is a is a visualization tools so you can visualize the whole slide you can visualize the different channels and if you want to make a quantitative analysis of the of the slide you have to export the whole slide tif file and bring it into a third party software for now at least.
How does Orion mitigate multiplex autofluorescence?
Wonderful and another question. How does Orion mitigate multiplex autofluorescence?
So the question is how we manage to to do this type of acquisition? We are using seven lasers and as I mentioned during the presentation we are using a specific type of filters that we can adjust in some position to correct only very narrow band of the spectrum. And so by doing that first we decrease a lot the problems of the overlaps between the channels but there are still a lot of overlaps that are happening. The minute that you try to look at the 15 or 20 markers together there are some overlaps. But the good news is that with the Orion we have built a matrix that where we know exactly what are the compensation to apply between the different channels and so automatically when the image is generated, the system knows which channels have been acquired and so we will apply those compensation to give you each individual channel for the different biomarker and that’s the way it works.
Are all antibodies incubated at once?
That’s great and another question about the antibodies, are all antibodies incubated at once?
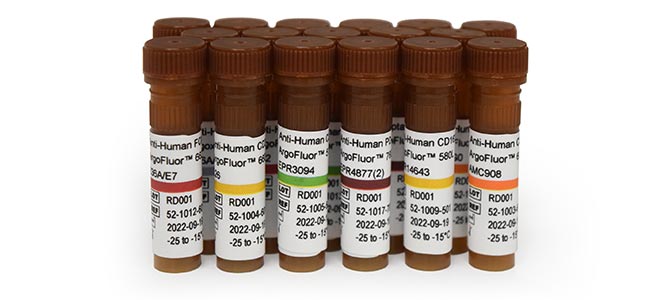
So yes, all the antibodies are incubated at once. The specificity of our approach is that we, all our antibody are directly conjugated so there is no need of amplification. We’ve done the with a second or third antibody to amplify the signal so because we are using directly conjugated antibody it allows us to put everything at the same time, to do only one staining step. And then during the acquisition for the camera will navigate into each position of the slide and take images in the different channels so.
Is there a limit to the size of a tissue section?
Wonderful and just one or two more questions about the size of the section, is there a limit to the size of a tissue section?
I would say the limit is the size of the slide. We are really able to scan the whole slide so the limit will be the glass to put the tissue.
Are fluorescence images and Hamp;E images registered?
Wonderful and one more question here. Are fluorescence images and Hamp;E images registered?
Say it again
Are the fluorescent image and H&E image registered.So I’m not sure I understand but like do we have a connection between the Hamp;E image and the fluorescent image if this is the question. At this stage no there are two separated images but I hope that soon we are able to switch from Hamp;E to fluorescent as like if the Hamp;E is a channel by itself. Right now in our software there are two separate images but again there are two separate images of the same exact slide so it’s not a several section it’s really the same piece of tissue so it is very easy to switch from one to the other one because, you know the localization of what you are looking at is exactly the same on the screen and on the image.
Are the Orion images taken at a 20X resolution?
Wonderful and actually so one more quick one. Question: are these images taken at a 20X resolution?
So no we can in our process we actually like to use the 4X to have a very quick overview of the of the tissue that scan takes you know a couple of minutes to scan the old slide in 4X. Then there is a 10X we have a preference for the 20X for the, for the scan because it gives speed at the same time that then it gives a good resolution. It’s about 0.5 micron. So it’s way enough to have a single cell resolution but for people that would like to have a subcellular resolution then there is a 40X also on the system. But the majority of the users are actually using the 20X right now. Wonderful well thank you very much everyone online.
Thank you for joining and again a reminder if we weren’t able to get to your question we will be following up via email so do expect that from a sales representative from our site and thank you again for joining us have a wonderful evening and wonderful rest of your day.